Wall Of Worry
Let’s start with the economic data. Despite Japan’s supply chain disruptions, economists have generally remained optimistic on the outlook. The Wall Street Journal’s early-April poll of 56 economists found just a slight trimming of their consensus Q1 GDP growth estimates, followed by no changes to their robust >3% forecast through the remainder of 2001. This is not New Normal. If this old normal recovery pattern plays out as economists expect it will be very good news, indeed.
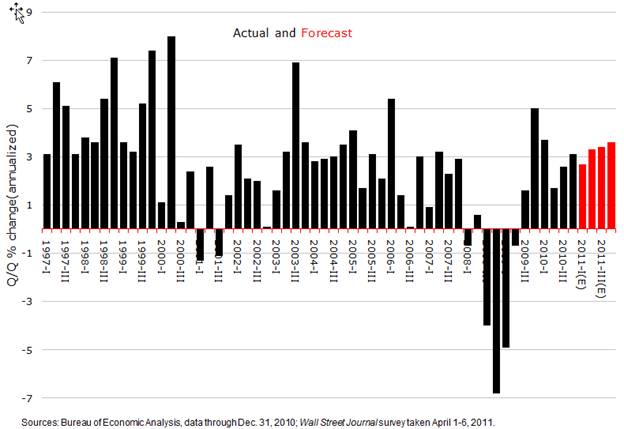
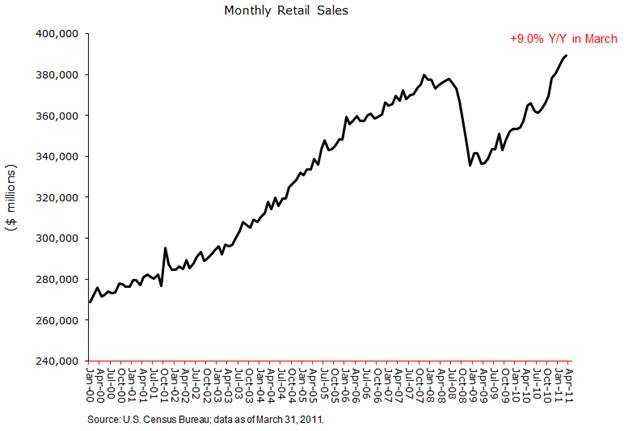
On what are they basing this fairly rosy scenario? Mostly, it’s confidence that the recovery in consumer spending will continue. So remarkable to the bears has been the resilience in retail sales, which have gone out to new highs.
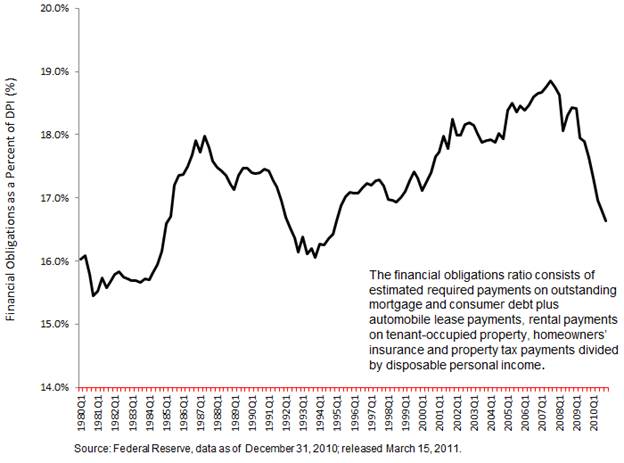
The cornerstone New Normal argument was that a consumer-driven recovery would be impossible because Americans will be many years digging themselves out from under a mountain of debt. Actually, the Federal Reserve’s key financial obligations ratio belies this notion. It makes clear that Americans have already substantially de-leveraged and re-liquified such that today, in the aggregate, American households are better prepared for a trip to the mall then they’ve been for most of the last 30 years.
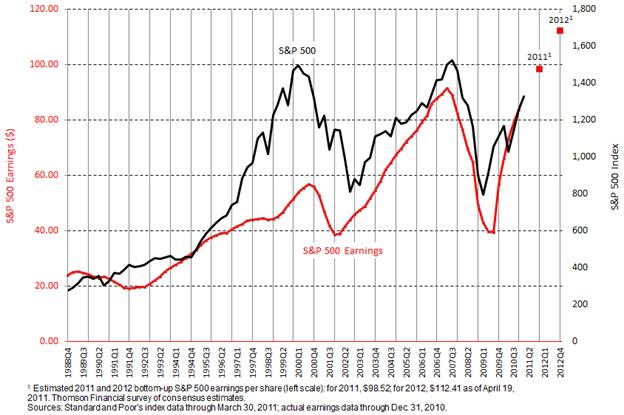
So, if consumers can and do continue to drive the recovery as economists are forecasting, corporate earnings are headed substantially higher. Earnings drive stock prices. Again in April, Wall Street analysts raised their 2011 and 2012 S&P 500 earnings estimates. See the latest consensus bottom-up earnings forecasts in the following chart. Fast-forward nine months to the end of this year, apply a market P/E multiple of 15 times to the estimated $98.52 in 2011 earnings and the S&P 500 index would finish the year at 1480 – up +11% from here (1330). Yes, there are risks to the economic outlook. But I think this basic arithmetic on top of another strong earnings momentum quarter (Q1 just finished) is what’s behind the stock market resilience that many pundits find so amazing.
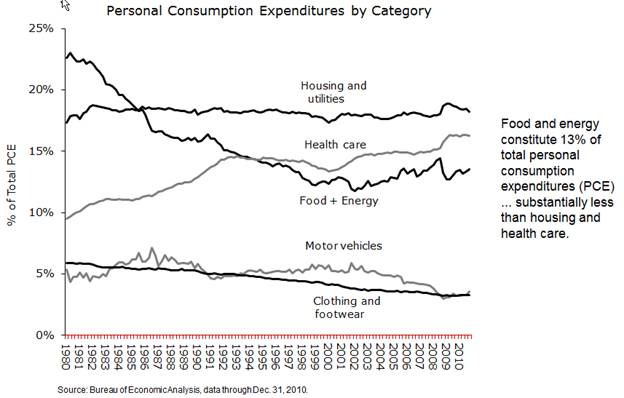
What about those surging commodity prices? The reason Ben Bernanke has maintained that their effect on overall inflation will likely be transitory is found in the following chart. Spikes in food and fuel prices have, in fact, been transitory in the past. Furthermore, the degree to which food and fuel inflation has fed through to the CPI is, perhaps, less than one might think.
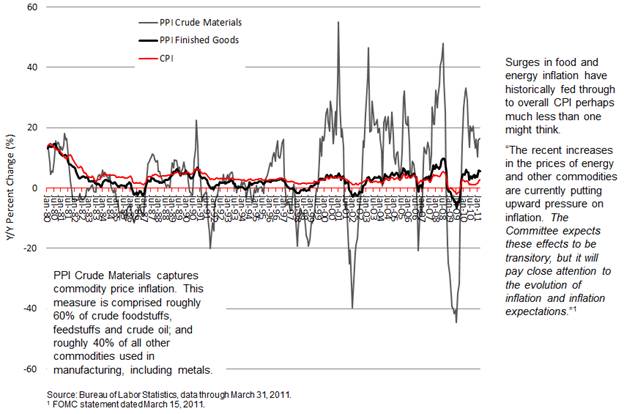
Food and fuel, combined, constitute 13% of personal consumption expenditures. My guess is that most Americans would be stunned to learn that this figure isn’t a good deal higher – and that’s likely due to what economists call the “frequency bias.” We consumers are exposed to rising prices for gas and groceries just about every day vs. other lower-profile but larger spending categories.
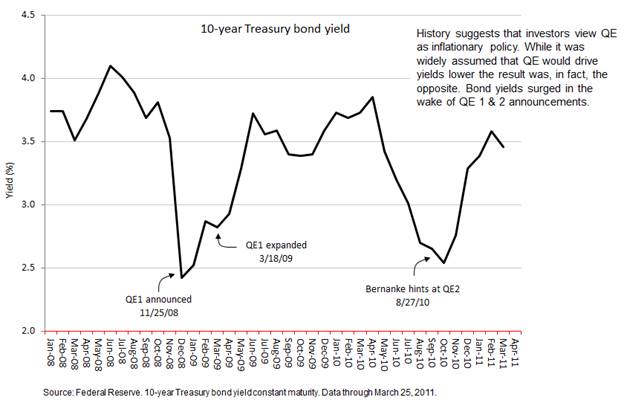
Will the end of QE2 mean higher bond yields and a threat to recovery? One might suppose that bond prices would drop with the Fed no longer a significant regular buyer. However, take a look at the brief history of QE vs. bond yields. As a matter of fact, it has worked precisely the opposite. I think the key is that bond buyers view QE as inflationary policy – so its demise could be good news for bond prices.
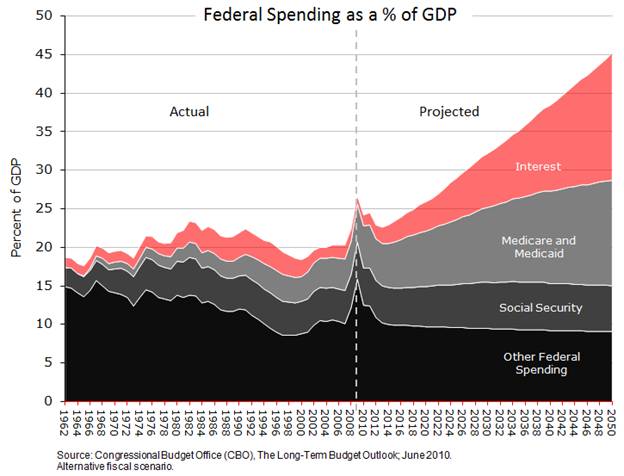
Finally, let’s run through the numbers relating to S&P’s U.S. bond rating outlook downgrade. In the first chart, below, see the Congressional Budget Office’s latest long-term (out though 2050) fiscal forecast released June 2010. The analysis makes so clear how long-term unsupportable current entitlement programs are.
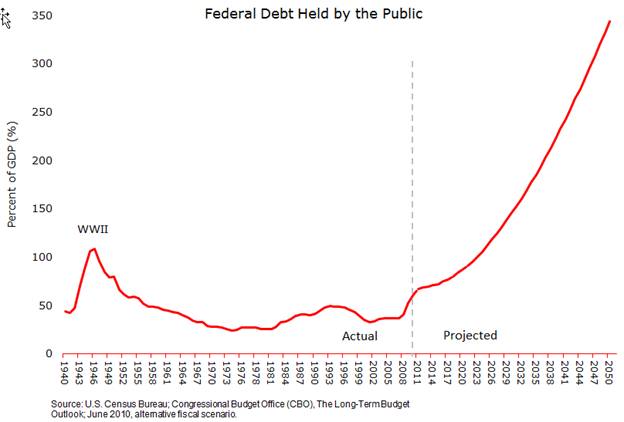
In the second chart, below, see how federal debt outstanding soars as a consequence. It seems to me that S&P is simply pointing out the obvious – that the U.S. will collapse under its mountain of debt unless it embarks on a serious course change with respect to entitlements.
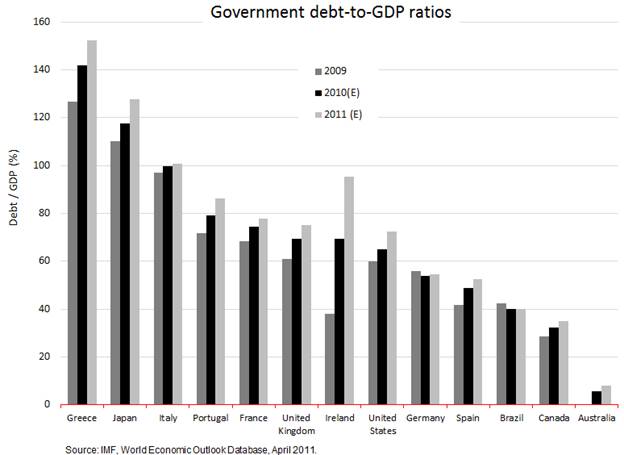
Finally, I think this chart is useful in putting into context the U.S.’s near-term debt-to-GDP ratio. For right now, the U.S. is better off than some. But, were we to follow the trajectory in the preceding chart, the U.S. would become Portugal within a decade, then Greece. That would be disaster.
This Website Is For Financial Professionals Only