Professor Craig Israelsen Answers Advisor Questions About Managing Broadly Diversified Portfolios; Israelsen To Speak Quarterly At A4A CE Webinars
Interviewing Israelsen November 9 during an A4A webinar, I asked him why he didn’t manage money. Wouldn’t that be more lucrative than selling his research for $150 a year (after a first-year fee of $350)?
“I enjoy writing and I enjoy speaking,” Israelsen said. “If I register, then FINRA or the SEC will have oversight over me, and I’d rather not be beholden to those rules. So I try to align myself with people who are registered. I can just sell research and not manage money, which means I’ll never really be in the money pipeline.”
Israelsen stammers, then blurts out his existential essence: “And this may sound ridiculous, but I’m not really money motivated,” Israelsen said. “I like writing, I like researching. I just get a kick out of being able to publish what I want, where I want, and then helping advisors—if they choose—put that into practice.”
Israelsen is a special kind of guy.
So I am pleased to announce that A4A members in 2013 will receive free updates on Israelsen's ideas every quarter at A4A webinars. (In addition, Advisor Products in 2013 will start producing content for advisor clients based on Craig Israelsen’s 7Twelve strategy, and also distribute his slide presentations. If you’re interested in using that content for your newsletter, website, social networks, or client meetings, please email info-at-advisorproducts.com.)
At the November 9 webinar (free to replay 24/7 for A4A members and eligible for CFP and IMCA CE credit), Israelsen did not get to answer all of the questions that followed his presentation. Here are some of the questions and his answers.
How many advisors now using your service?
Over 500 advisors as of November 2012. Plus, several hundred individual investors.
Looking at worst three-year return over the past 42 years for the 7Twelve portfolio is instructive but is it enough data? We just had a storm here in Long Island that has no match going back 30 years, but there was a storm that bad here in 1938. Is it statistically valid to use a 42-year history when looking at investment returns? If not, please explain how you use your good judgment to compensate.
42 years is the period for which I was able to obtain reliable, index-based returns for 7 core asset classes: large US stock, small US stock, non-US stock, real estate, commodities, US bonds, and US cash. Some of the asset classes have performance histories before 1970 (such as large US stock, small US stock, US bonds, cash) while others don’t. I feel that 42 years represents a long-enough time frame to judge the correlation of performance among these 7 assets. One particular asset class—US bonds—is one that I’ve analyzed back to 1948 because the past 30 years (1981-2011) have been an unusually good period for bonds given the decline in interest rates during that last three decades. By evaluating the performance of US bonds back to 1948 it’s possible to get a picture of bond performance during periods of rising interest rates as well as during a period of declining interest rates.
Has anyone done research into whether a 50-, 60-, or 70-year history looks anything like the 42-year history?
The long-term return of US stocks (large and small) back to 1926 is nearly identical to the performance of large and small US stock since 1970. As of 12/31/2011, the annualized return of large US stock since 1926 was 9.8%, whereas from 1970-2011 it was 10.0. For US small stock, the annualized return in 1926 was 11.1% and from 1970 it was 10.8%. US bonds have averaged 5.5% per year since 1926, and 8.2% per year since 1970. So, US bonds are one asset class that has performed “out-of-character” over the past 30-40 years.
Have you noticed a trend where correlations among asset classes are closer in the last decade? Is small-cap value and small-cap growth looking the same?
Please see the article (embedded below) that I wrote on this issue of dynamic correlation patterns.
Have you or some other academics examined the changing correlations between the major asset classes, examining the fundamentals driving them?
See the article (embedded below). But, let me add, that “herd-mentality” buying-and-selling contributes to increases in correlation between major, investable asset classes.
Is it fair to say that the way you present the correlations data is akin to using technical analysis?
Technical analysis typically involves numerical or graphical analysis in an attempt to forecast the timing of investments or the timing of a certain asset allocation. My analysis of correlation patterns is not aimed at forecasting which assets to hold or sell, but rather to better understand how certain asset classes interact with each other (in terms of their performance patterns).
What’s the cost of your service? And in what form are your main research products delivered?
There are several products that I sell to financial advisors.
1) 60+ page “7Twelve Portfolio Research Report”—a highly detailed, turn-key document that guides an advisor in assembling various 7Twelve portfolios (“Active” model, “Passive” model, Vanguard model, T. Rowe Price model, Fidelity model, DFA model, and a tax-efficient model). The initial purchase price is $350, annual updates after initial purchase are $150. Annual updates are not mandatory.
2) 50+ slide 7Twelve Portfolio PowerPoint slide deck. This slide deck provides a general overview of asset allocation, followed by an introduction to the 7Twelve Portfolio. The one-time purchase price is $250. Annual updates are sent free of charge to those who have purchased the 7Twelve Powerpoint.
3) I also sell 7-8 page “short-format” Research Reports that highlight the construction guidelines for various family-specific 7Twelve portfolios (Vanguard, Fidelity, T. Rowe Price). These reports are $75 each.
4) Finally, I occasionally prepare “customized” short-format 7Twelve Portfolio Reports for advisors (e.g. John Hancock 7Twelve Report, Jackson National “Elite Access” 7Twelve Report). These reports outline in specific detail the funds or sub-accounts at those firms that can be utilized to build the 7Twelve Portfolio. The price for customized 7Twelve reports is negotiated.
Is there a published track record?
The performance of the 7Twelve portfolio can be tracked back to January 1, 1998. The ingredients of the 7Twelve portfolio are actual mutual funds and ETFs with asset-based, published performance. The performance of the 7Twelve Portfolio is the aggregation of the performance of 12 funds—all of which have published performance histories. To see the performance of the 7Twelve Portfolio go to www.7TwelvePortfolio.com.
Is there a 7/Twelve fund or ETF?
Yes. The 7Twelve Balanced Fund is available at AXA Equitable Retirement Cornerstone. To learn more about the 7Twelve Balanced Fund go to www.7TwelveAdvisors.com.
Why don’t you manage money?
I prefer teaching and writing and designing investment models.
What do you mean looking for ethical fund companies to work with? How do you judge whether they’re ethical?
Ethical mutual fund families are not involved in “late-trading” scandals, they always work to lower costs to investors, they encourage tenure and stability in their fund managers, etc.
Is there a rebalancing software solution that you like?
I use Excel.
Do you take into consideration any forecast inputs in asset classes, or all based on historical returns?
I have not found forecasts to be helpful in long-term portfolio design.
Have you tested rebalancing using contingent triggers other than time frame, i.e. percent of deviation?
I haven’t. The challenge in that approach is determining how many of the 12 asset classes would need to hit the percent of deviation trigger to activate an overall rebalance across all 12 asset classes. Some of the 12 would not likely be at a trigger point, while others would.
Have you started with commodities or REITs and added components in a different order to determine incremental risk & return
Good question. I haven’t, but it’s a cool idea.
Aren't commodities often a large component in your typical International Large Cap fund already?
The commodities fund does not own stock in companies, but rather it owns futures contracts.
Would the Morningstar Stewardship metric be a good judgment of a company's ethical behavior?
Yes, that is a good starting point. However, there are other pragmatic considerations such as whether the mutual fund company was involved in late trading scandals, or any other illegal practices. Does the company reward tenure among their managers—a sign of a long-term investment philosophy. Does the fund company hyper-promote trendy mutual funds—not a good sign.
Did the active versus passive options performance reflect fund expense?
The “Active” 7Twelve portfolio costs about 80-90 basis points to build, whereas the “Passive” 7Twelve is about 30-40 bps. The expense ratios for all of the funds used in both models are already reflected in their published performance, therefore the performance differential between the Active and Passive 7Twelve models reflects the inherent differences between active management (with its inherent non style-pure approach) and the style-pure approach of the ETF-based Passive 7Twelve model.
Would you consider International TIPS as part of US TIPS or International Bonds or separate? Same question for International Real Estate.
Good question. At this point in time, I would be inclined to co-mingle International TIPS with US TIPS. With regard to Real Estate, I prefer a global REIT fund where possible. Alternatively, one could mix a US REIT fund with an International REIT fund within the 8.33% “Real Estate” slice in the 7Twelve model.
How long has his 7Twelve been around and what history of advisor use and their outcome?
I developed the 7Twelve model in the spring of 2008. The model has been back-tested to January 1, 1998. Advisors have been using the model for actual client portfolios since 2008. I can provide names of advisors who are willing to share their experience using the 7Twelve model. Please contact me directly.
What percentage of core to explore?
If the 7Twelve model is used as the “core” component of a client’s portfolio it could represent anywhere from 25% to 100% of the overall portfolio. For younger clients, a 100% 7Twelve model is perfectly adequate. Older clients and/or clients with more sophisticated situations may require more specific “explore” assets and possibly the explore asset would represent a larger percentage of the overall portfolio. As a general rule, it is my sense that the 7Twelve model typically represents 50%-75% of the overall portfolio. The “explore” assets are often legacy individual stocks that the client doesn’t want to part with.
This only works with mutual funds versus third-party managers versus individual stocks. Right?
The 7Twelve model works best with mutual funds. But third-party money managers and individual stocks could certainly represent some portion of the client’s overall portfolio. The 7Twelve model would represent the “core” and the third-party managers and/or individual stocks could be “explore” assets.
With low rates of return on collateral and so many commodities in contango, are commodities still an appropriate piece of this puzzle?
Great question. The hallmark of the 7Twelve model is its commitment to all 12 asset classes at all times. Understandably, some asset classes will underperform at any point in time. The 7Twelve model does not attempt to time when to be in and out of certain asset classes. Lunt Capital Management in Salt Lake City, Utah (www.LuntCapital.com) has built a “Rotational” 7Twelve model that has a more tactical approach, albeit within the structure of the 7Twelve model.
How do you get return figures in the 1950s for all of your asset classes?
I was able to source performance returns for 7 asset classes (large US stock, small US stock, non-US stock, Real Estate, Commodities, US Bonds, US cash) back to 1970. Primary data sources included Morningstar, Ibbotson, and the index makers themselves (S&P, Goldman Sachs, Wilshire, etc.). For data prior to 1970 (large US stock, US bonds) I utilized either SBBI by Ibbotson or the Economic Report of the President (which is available on-line).
What happened to the 7Twelve mutual fund?
Asset growth was not rapid enough to warrant keeping the fund open. Hopefully there will be a rebirth of the 7Twelve fund – this time with a sales force that can help grow assets more quickly. One of the challenges is that the 7Twelve design is very transparent—investors and advisors can simply build it themselves rather than purchase a one-ticker 7Twelve fund. I believe that over time a sufficiently large demand for a one-ticker 7Twelve fund will warrant its rebirth.
Q: Are there any studies that suggest how slowly or rapidly correlations change?
The article embedded below article examines the patterns of correlation among the returns of 12 broad investment asset classes over the nine-year time frame from 1993-2011.
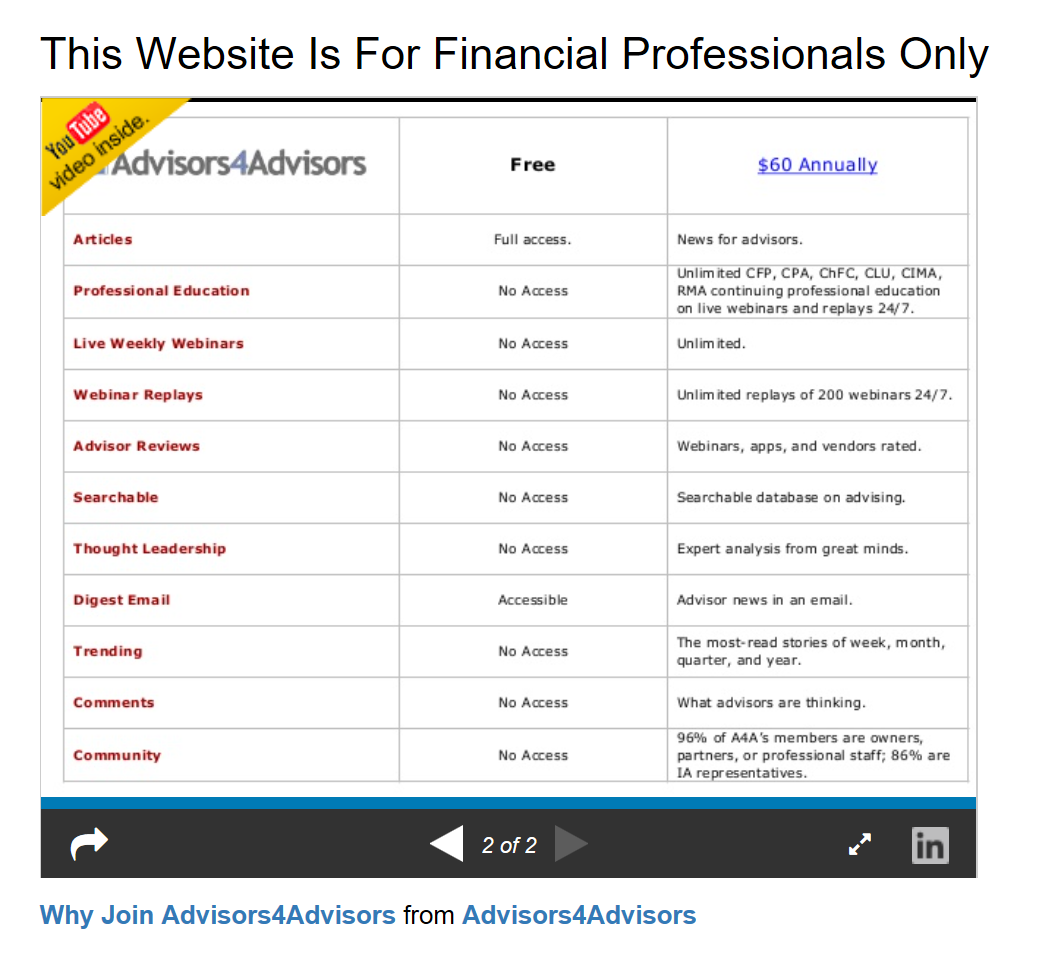
This Website Is For Financial Professionals Only